Kaya's blog A Data Science Blog:
    About     Archive     Feed

Twitter Topics -- Anti-vaccination and Pro-vaccination

Although it’s easy to tell whether a Twitter user is antivax or provax when they’re tweeting about vaccination, is there any way to differentiate between these two groups when they’re not? Natural Language Processing provides the tools to analyze tweet content and investigate the salient topics in a group’s messages.

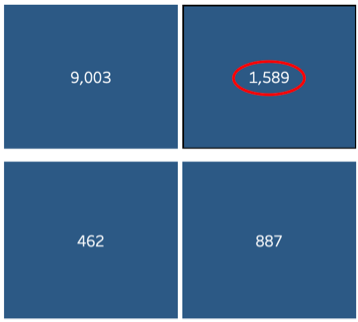
The tweets from the antivax and provax groups were obtained by first searching the web for a few popular articles and accounts that are widely retweeted by each camp. Then the user IDs of accounts that retweeted these were gathered via tweepy. Thereafter, the tweets available via Twitter’s API from each user ID were collected and stored in MongoDB, since these tweets do not have a fixed schema, and a non-relational database is most suited in this case.

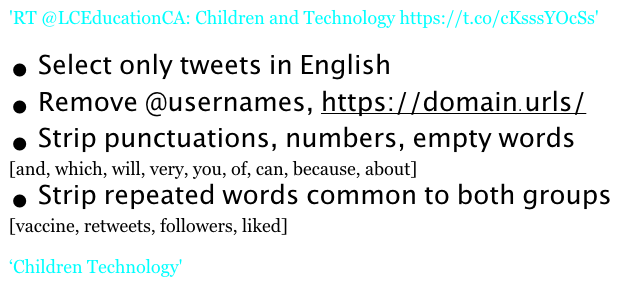
Everything else besides the text portion of each tweet is stripped from the dataset; the text strings are further cleaned so that only English content remains; and usernames, punctuations, and numbers are removed from the strings. Empty words (very, because, which, and, etc.) and repeated words common to both groups (followers, liked, retweets, vaccine, etc.) are also removed. An attempt at stemming and lemmatization did not result in significant improvement in this investigation, but may prove worthwhile elsewhere.

Method1

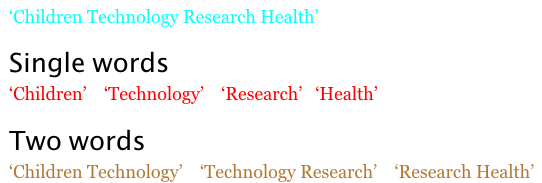
The remaining sentence is then broken up into units of a single word or 2 adjacent words. From each of the two camps, we try to find common words or units of 2 adjacent words, then group the similar ones together and interpret the result for salient topics. The process of breaking up the string into word units relies on CountVectorizer or TFIDF vectorizer. After which, the process of finding common word units and grouping them together, or extracting latent topics from the word units, can be done via a few topic modeling techniques including Latent Semantic Analysis and None Negative Matrix Factorization.

Method2

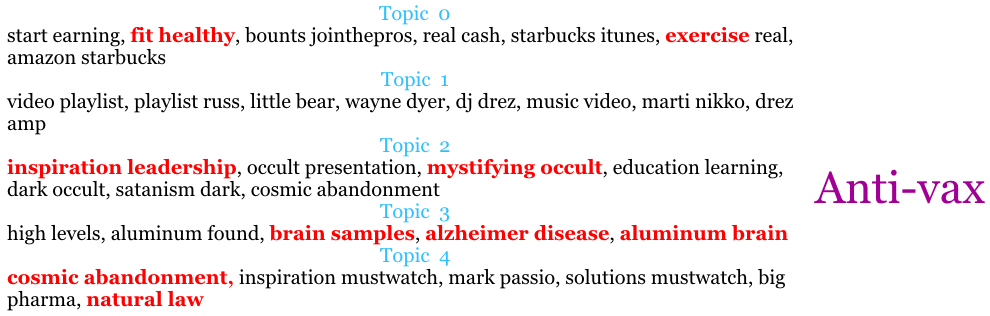
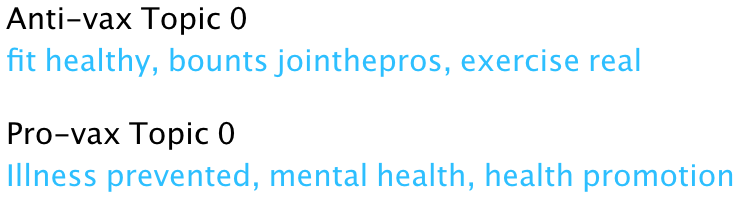
Below we see the groupings or topics of similar single word units from both camps:

Antivax single words Provax single words

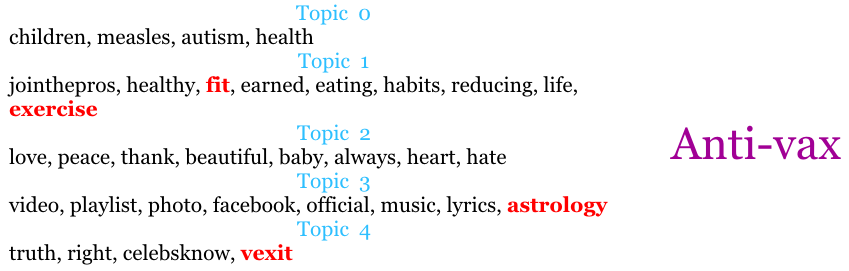
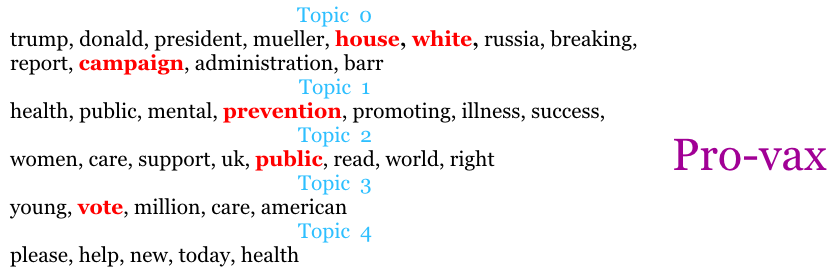
It appears that the antivax group has some topics about fitness, exercize, and healthy eating, which may imply belief in taking an active role on the part of the individual in controlling their own health. Meanwhile, the provax group has some topics on politics and prevention of diseases, healthcare and voting, which may imply an approach to health through public legislation and group effort.

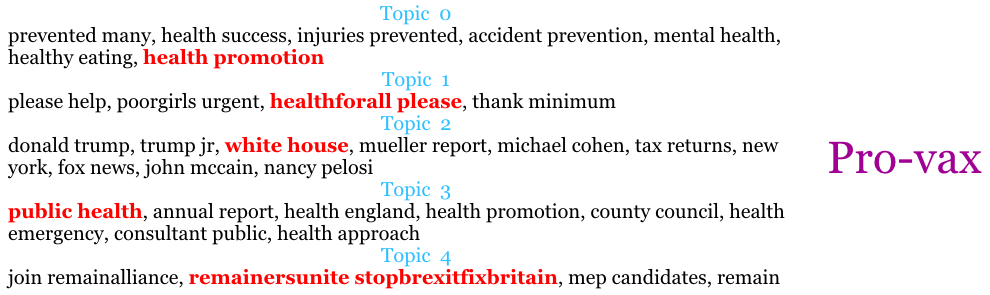
Since we’re only getting limited insight from single word units, we should find the results more interpretable when we also look at the two-adjacent word units.

Antivax adjacent words Provax adjacent words

Topics of 2 adjacent word units shown above seem to suggest that the antivax group places significant emphasis on fitness and exercize, and there is also concern about aluminum in food causing Alzheimer’s, but there’s also astrology, cosmic abandonment, natural law, and the occult. A possible guess in light of the topics on inspiration and leadership might point all these toward a similar focus on the individual’s efforts to improve their own health.

In the same vein, the provax group shows political interests in the Brexit Remainers Unite and White House topics. There’s also promotions of public health awareness and accident prevention, and calls to help the underprivileged, which fit with their group effort approach.

Although only the top 5 topics were shown in the above cases, we can use clustering techniques to group together more of the other (say, the top 30) topics to visualize how they’re distributed. For example, using K-Means clustering or DBSCAN clustering, the high dimensions in the topic space can be compressed to 3D space for visualizing with T-SNE.

K-Means

Cluster # tweets
0 1922
3 28
1 20
4 15
2 15

K-Means clusters with T-SNE

DBSCAN

Cluster # tweets
0 1808
-1 95
4 20
7 19
3 15
5 14
11 6
6 6
9 5
10 3
8 3
2 3
1 3

DBSCAN clusters with T-SNE

In these visualizations, the yellow dots represent the most salient tweets, Cluster 0, from antivax users. The 4 other clusters assigned by the K-Means algorithm only take up a few regions in the space. With DBSCAN clustering, the black dots scattered randomly around the entire space are actually the noise designated by DBSCAN, meaning they don’t belong in any of the 12 clusters.

The visualizations showed one oversized group compared to all others, which seems to indicate a general focus in the tweeted content, and such overall trends can be summarized by how each group is distinguished by their outlook on health:

Antivax and Provax topic 0s

Again, these appear to fit closely with the themes below: Antivax – individual fitness and exercize Provax – group health promotion and illness prevention

These twitter accounts seem to be quite focused in their topics, and it’s probably not hard to guess which camp a user belongs to if one observes a handful of their tweets.

Data source: Twitter APIs

Tools

  • Tweepy
  • MongoDB
  • nltk
  • SciKit-Learn
  • Matplotlib
  • Plotly

Predicting Bank Telemarketing Outcomes

With data gathered between May 2008 and Nov 2010 by a Portuguese bank on their telemarketing calls, we can predict whether a client will subscribe term deposit if the observations are analyzed as a classification problem.

Each marketing call has a set of personal features associated with the client, such as job type, marital status, education level, and age, which are client profile-related. This set of features also include a few that are related to the marketing call itself such as the number of previous calls and the month of the year for a call.

It also has a set of global features independent of the particular client, which indicate the social and economic context, such as consumer price index, employment variation rate, and Euro Interbank Offered Rate.

Features

Since there is a class imbalance between the cases where the client subscribed term deposit (success) vs the cases where the client did not subscribe term deposit (failure): 10% vs 90%, the data was upsampled with random oversampling to ensure better results.

A handful of models were trained using 70% of the dataset, and tested on the holdout 30% to predict the outcomes based on those features. The models were evaluated for F1 score and Accuracy. Since we’re interested in predicting the successful calls, we focus on the true positives which is the bottom right quadrant on the confusion matrix.

Looking at the confusion matrix associated with different models, it’s easy to see that the Bernoulli Naive Bayes model and the Decision Tree model don’t do very well, because the False Positive rate was much higher than for the better models, meaning these two models predicted about 2900 cases to be successes when these were actually failures. The better models made only about 1600 such predictions.

Bernoulli-DT

The Gaussian Naive Bayes model did the worst in this investigation, since its confusion matrix shows it did almost as bad as a dummy classifier for predicting False Positives.

Gaussian-DC

The Random Forest model produced the best accuracy score (0.88) out of all models, but its True Positive rate is also the worst out of all models. In this case, it’s much better at predicting True Negatives (predicting actual failures) to compensate for the accuracy score, and very bad at predicting actual successes.

Random-Forest

After eliminating the above, the two remaining models (Linear Regression and SVM) are both very good, but ultimately Linear Regression was chosen because it has a slight advantage in predicting True Negatives (cases of actual failures). It also has the best F1 score overall, which is a weighted measurement of precision and recall.

LR-SVM

However, the F1 score is dependent on the positive class decision probability threshold that is chosen for this model. In this case, the best F1 score was achieved when a threshold of 0.74 was selected.

F1-Threshold

Taking into account the tradeoff between precision and recall, consider that our purpose is to predict successful outcomes (more True Positives and thus higher Recall), so the default threshold of 0.5 is better than trying to achieve the highest F1 score (at a threshold of 0.74) or accuracy.

Precision-Recall-Tradeoff

In conclusion, looking at the most significant coefficients from the Linear Regression model, it becomes clear that the top 3 features predicting the success of the bank’s telemarketing are actually not related to the individual client, but associated with the global economic climate.

Clients are more likely to subscribe term deposit when the consumer price index and the euro interbank offered rate are high. The interbank offered rate is just interest rate at European banks lending to other banks, so when it’s higher, the term deposit rate is more attractive. When the consumer price index is higher, there’s more inflation, so clients may be more conservative and are more likely to subscribe term deposit.

Clients are less likely to subscribe when the employment variation rate is high since it represents employees leaving or taking a job, and corresponds with robust economy, so when it’s lower, the economy might be worse, and people are more conservative with saving, thus more likely to subscribe term deposit.

Top 3 features

Additionally, False Positives may also be useful to the bank, because they are the group predicted by the model using the same set of features to be successes, and so more likely to have potential as future subscribers, whom the bank should consider enticing with other incentives.

False Positives

Data source: Bank Marketing Data Set

[Moro et al., 2014] S. Moro, P. Cortez and P. Rita. A Data-Driven Approach to Predict the Success of Bank Telemarketing. Decision Support Systems, Elsevier, 62:22-31, June 2014

Tools

  • Seaborn
  • Matplotlib
  • Pandas/Numpy
  • SciKitLearn
  • Tableau
  • Plotly