Predicting Movie Ratings
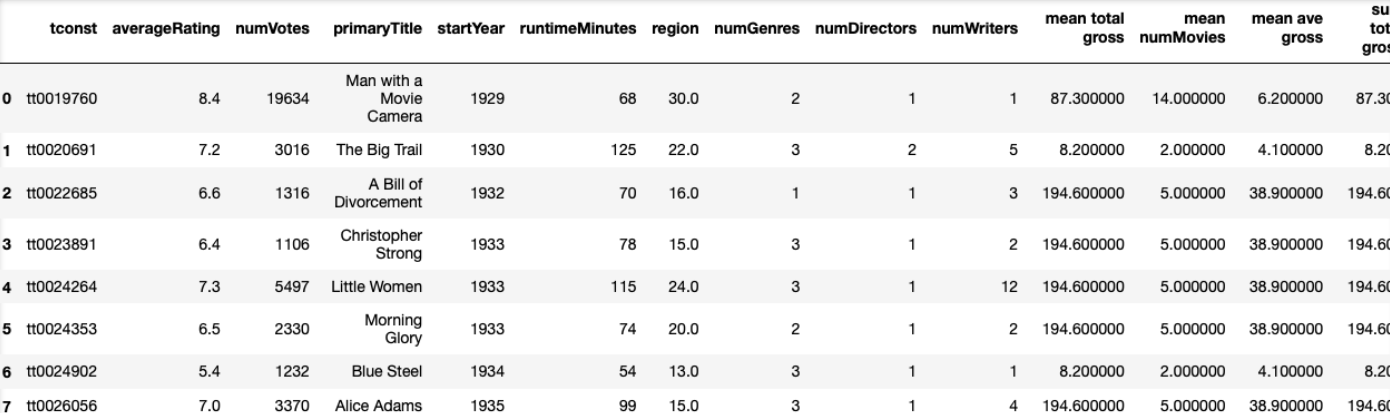
Movie ratings are publicly available on IMDB and Box Office Mojo, along with features such as runtime, budget, release regions, and past gross associated with the cast and crew. When we combine those with Kaggle’s IMDB 5000 Movie Dataset, there are more than 3000 complete records of movies for a linear regression analysis for the purpose of predicting a movie’s ratings based on such features.
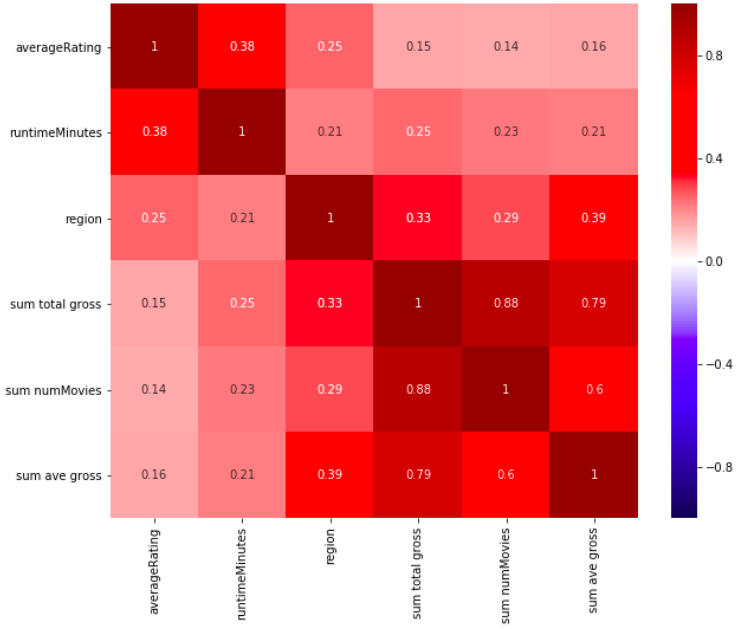
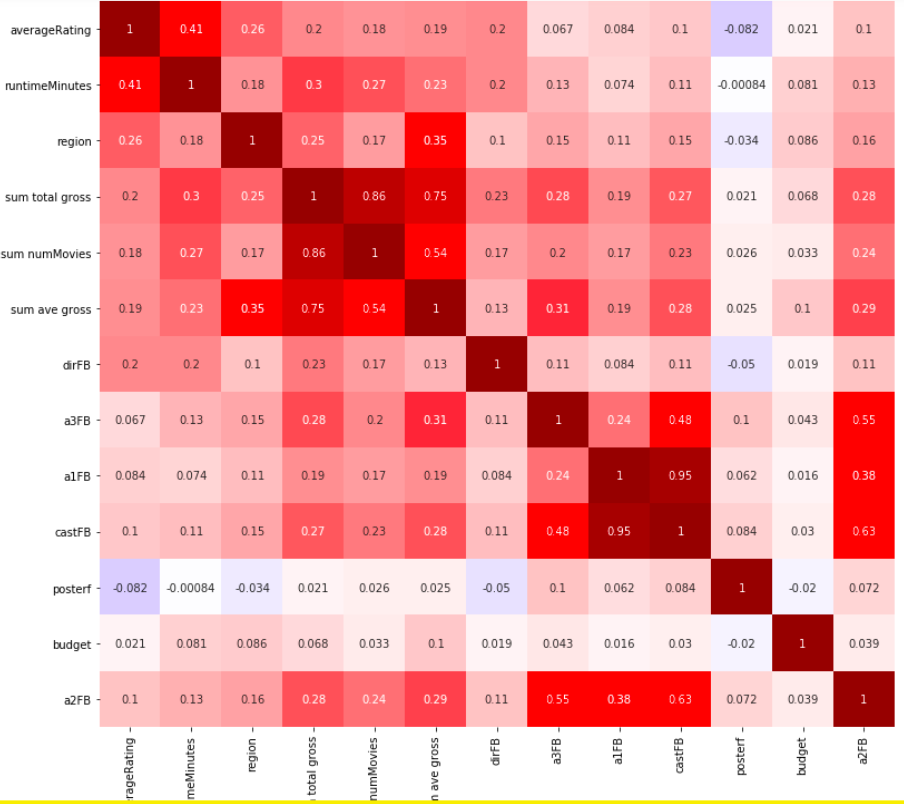
A correlation heatmap shows a promising selection of predictors such as *Runtime minutes *Release regions *Past total gross of cast/crew *Past number of movies *Director Facebook likes *Actor/Entire cast FB likes *Number of faces on poster *Budget
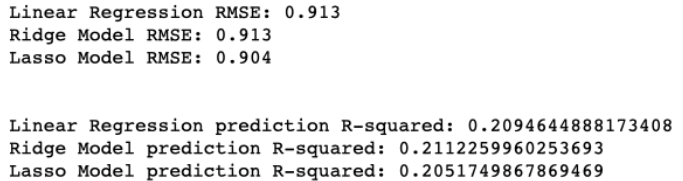
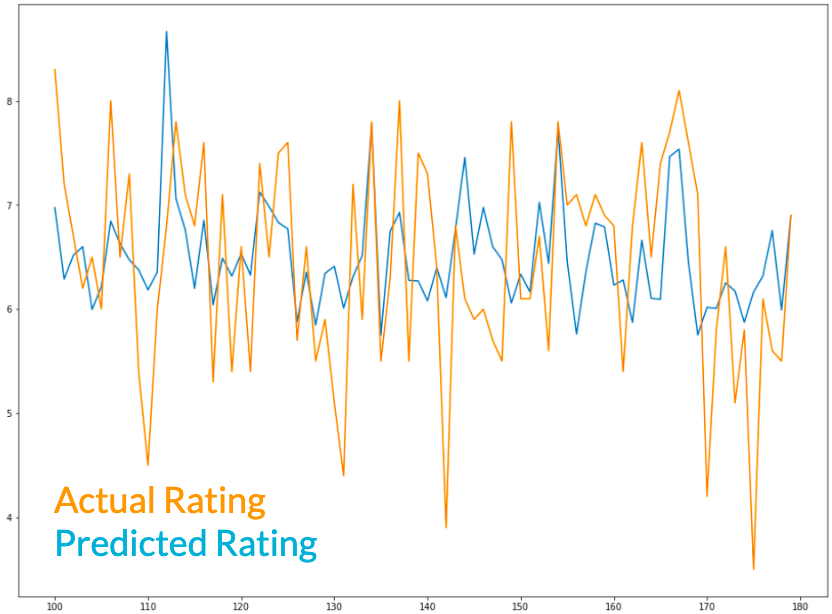
The three models (linear regression, ridge, lasso) all gave similar results in terms of R^2 and RMSE. An R^2 of 0.2 implies that about 20% of the variations in ratings can be explained by the variation in these features. And the RMSE of 0.9 measure the magnitude of errors in the predicted ratings.
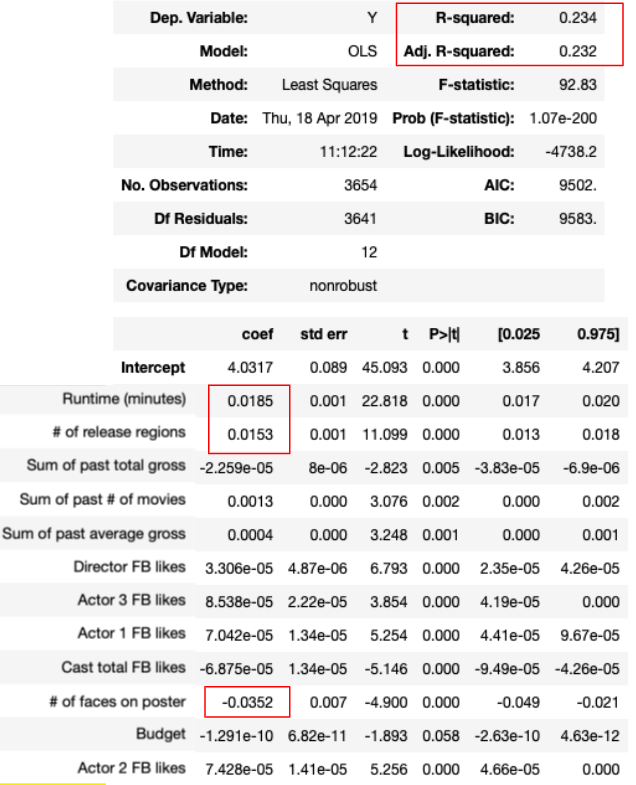
Regularization via Ridge and Lasso models was used to reduce model complexity, especially when there are too many predictors, the predictors are correlated, and/or the coefficients have large variances. The goal is to arrive at an optimal bias-variance tradeoff, so as to decrease model variance at the cost of introducing some bias, and in turn reduce overfitting and minimize the model’s total error when generalizing to a test set.
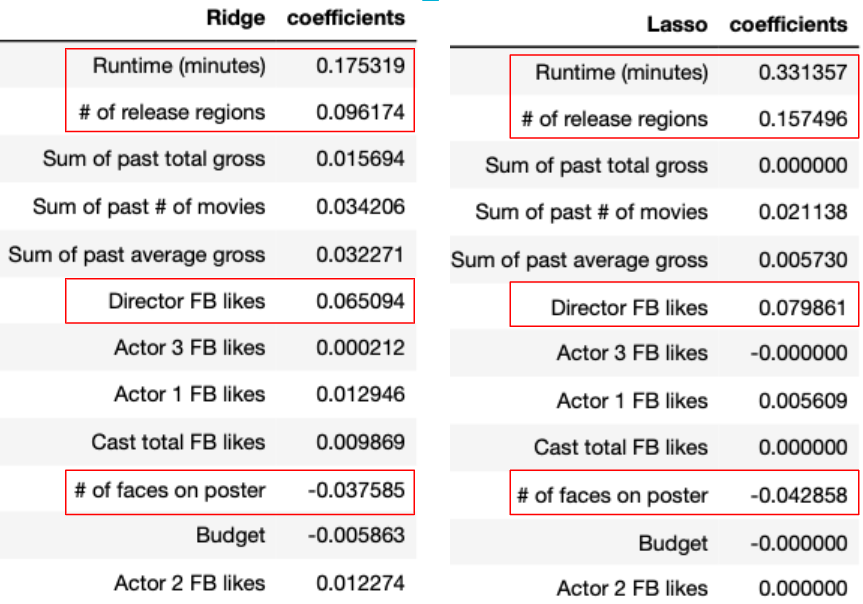
Looking at the Lasso coefficients for better interpretability, it’s clear that the most significant predictors of better movie ratings are: *Longer movie length *Release in more regions *Fewer faces on posters *Popular directors
Perhaps surprisingly and counter-intuitively, budget is not a predictor of ratings.
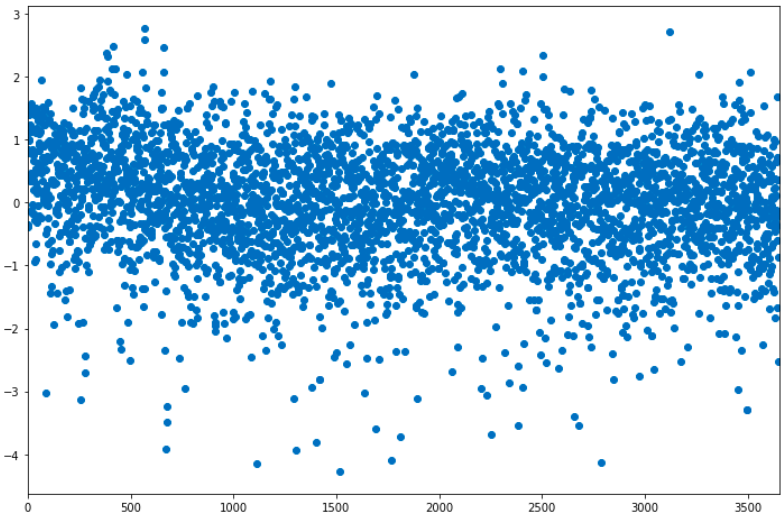
We can confirm that polynomial regression was unnecessary by looking at the residuals, which did not suggest heteroskedasticity.
Data source: Box Office Mojo / IMDB / Kaggle IMDB 5000 Movie Dataset
Tools
- Beautiful Soup
- StatsModels
- SciKitLearn
- Seaborn
- Matplotlib
- Pandas/Numpy